Why Silver
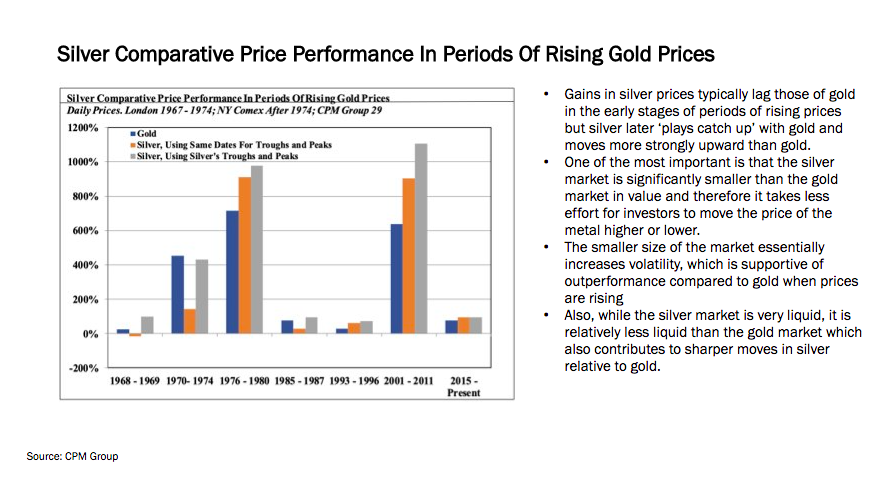
Silver outperforms Gold
When gold reached a new all time high of $2089/oz in August 2020 silver only achieved a peak of $30/oz versus its all time high of $50/oz in 2011. Many analysts expect that the resumption of the upward price trend should see silver catch up with gold and exceed its former high. The following charts show the outperformance of silver in secular bull markets.
The Beta of Silver Mining Companies gets as high as 3x
Beta measures the risk or volatility of a company’s share price in comparison to the market as a whole. For example, a company with a beta of 3x will theoretically see its stock price increase by 30% for every 10% increase in the price of the underlying commodity.

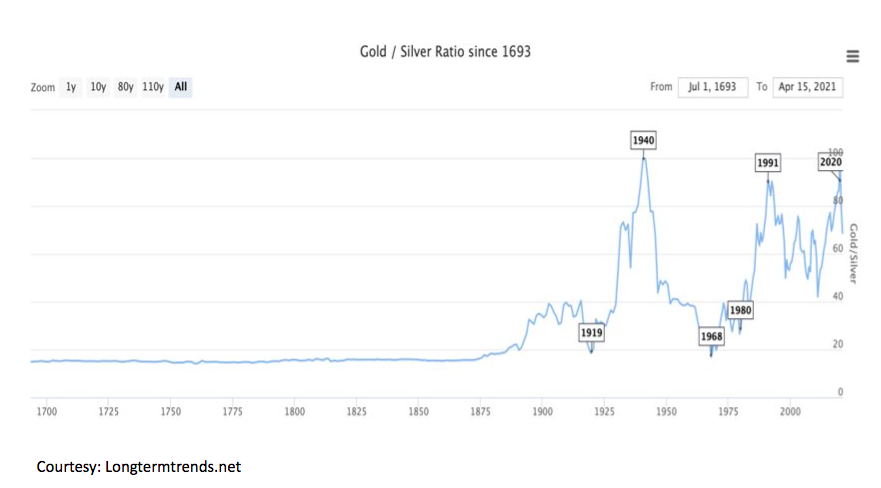
The Gold Silver Ratio is Dropping
The gold/silver ratio has been as high as 125/1 in March 2020. From 1693 to 1815 the gold/silver ratio was 15x (see chart below) and for most of the past two decades, the ratio has ranged from roughly 50:1 to 70:1. When the gold/silver ratio is in excess of 70x silver can be considered inexpensive relative to gold.
Some industry analysts argue that the gold/silver ratio could go to 8-10 whilst some people even don’t exclude a gold/silver ratio of 1.
Silver is an Industrial as well as a Precious Metal
Some 55% of silver consumption is from industrial applications such as electronics, medicine, solar water purification while some 20% of total silver supply is from recycling (50%+ recovery rates).
Source: Metals Focus
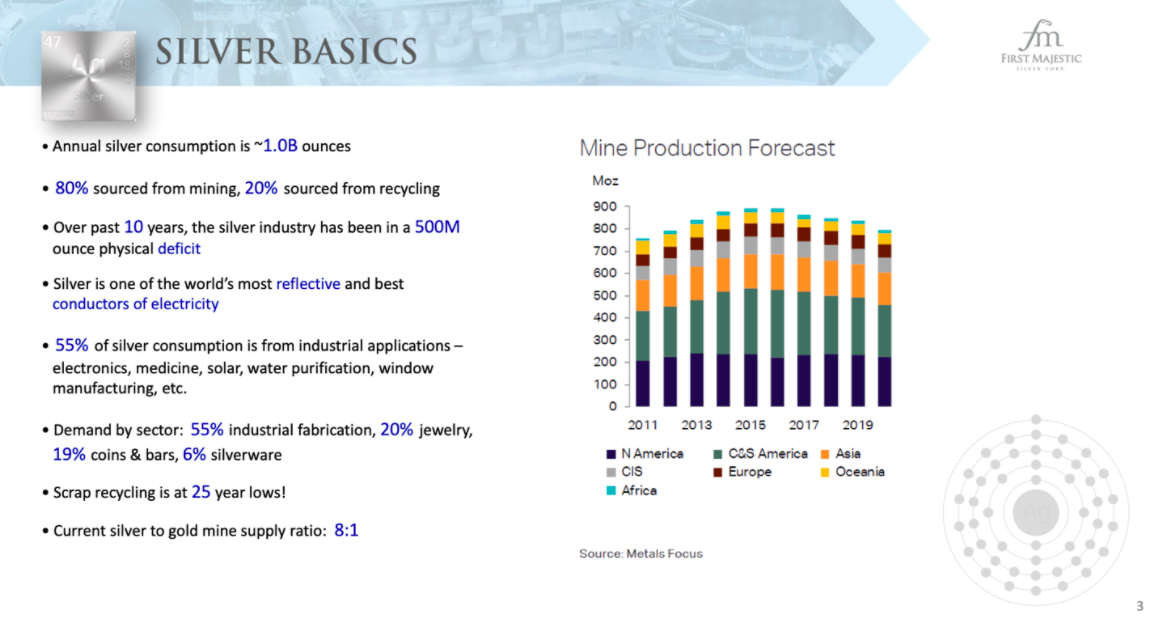
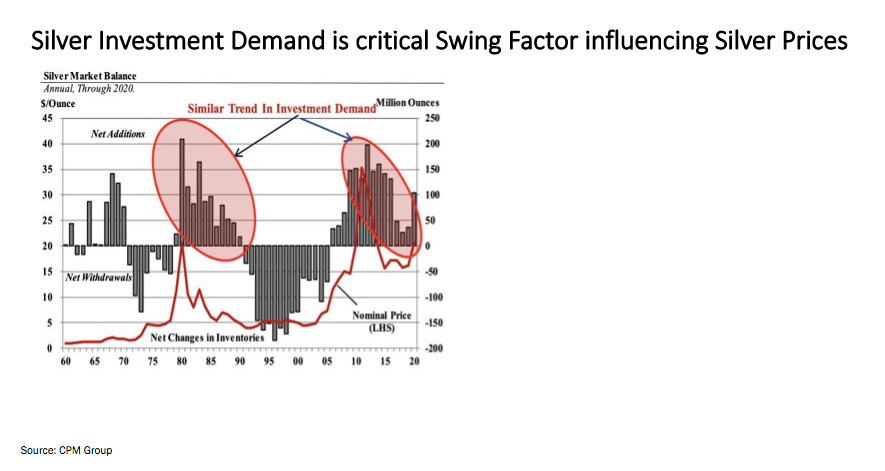
Total mine supply, which has been declining since 2015 due to more attractive returns from the tech sector, is approximately 822 Moz while recycling is around 173 Moz. Looking at all silver applications it seems that at present investment demand is the biggest swing factor for silver ranging between 180 Moz desinvestment in 1996 versus a 300 Moz investment in 2013 a swing of 480 Moz!
EVs will show very robust future growth expecting to account for 200 Moz in 2025 versus 65 Moz in 2021.
Source: The Silver Institute
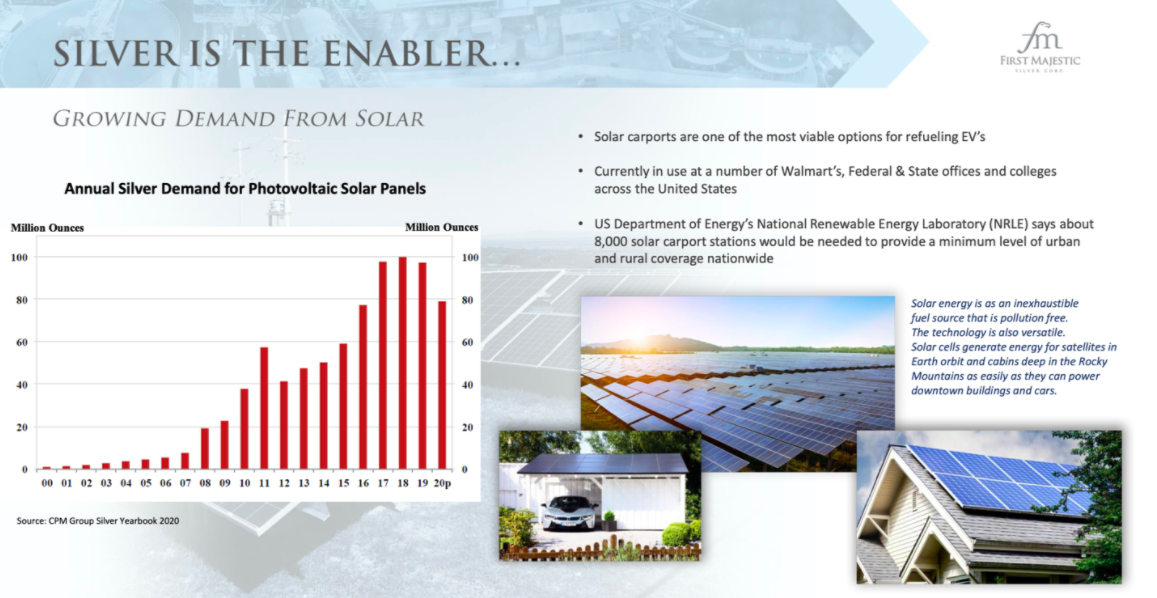
The Use of Silver in Solar Applications is Increasing Demand
An average solar panel uses some 20 grams or 0.643 troy ounces of silver. The PV sector consumed 114 million ounces of silver in 2021. Two thirds of an ounce of silver in every solar panel may not sound costly given today’s silver spot price but its contribution is invaluable. Silver’s cost contribution to solar panels outweighs its proportional expense over virtually any other application it has other than perhaps jewelry, silverware, or in .999 fine bullion coin or bar form. For instance, the average cell phone has only 200 to 300 milligrams of silver (0.006 – 0.009 oz). An average computer contains about 1 gram of silver (0.032 oz).
Source: The Silver Institute
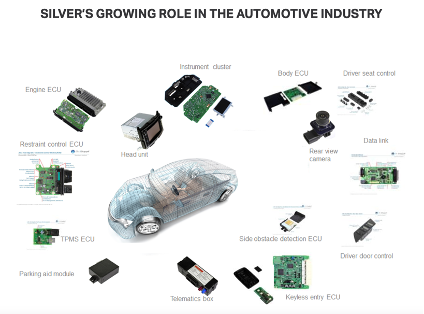
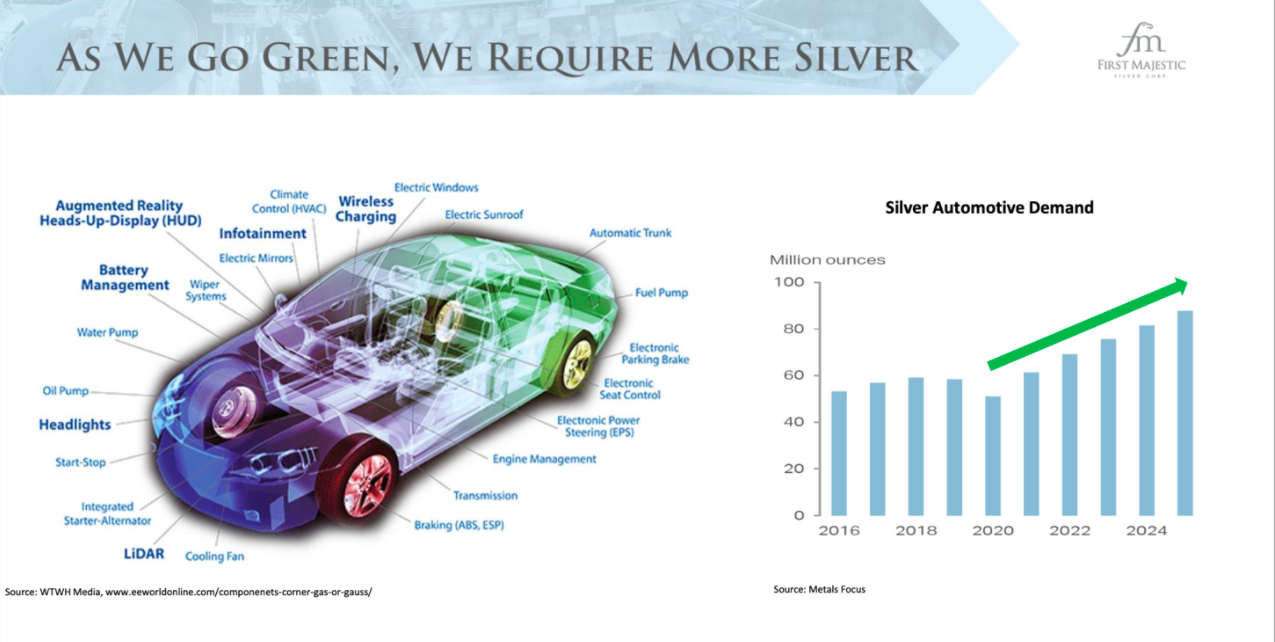
Strong Silver Demand forecast (300 Moz) from EVs by 2025
Growing ICE powertrain electrification has underpinned the increasing use of silver globally in the automotive industry. This reflects two key characteristics of silver, its unique properties of having the highest thermal and electrical conductivity of any metal and its widespread availability. According to IDTechEx (a consultancy that specializes in emerging technology), by 2029, there will be 10m public charges and 50m private charging points which will also need silver.
Average silver loadings, in each internal combustion engine (ICE) light vehicle, is estimated at 0.5-0.9 ounces (15-28 grams). In hybrid vehicles, silver use is at around 18-34g per light vehicle while battery EVs (BEVs) are believed to consume in the range of 25-50g silver per vehicle.
Global vehicle production is set to rise from a pandemic affected 74m units in 2020 to almost 100m by 2025. Internal combustion engine (ICE) powertrains will see their market share drop from around 90% last year to around 70% in five years’ time.
Global sales of battery electric vehicles (BEV) and other EVs vehicles reached sales of nearly 6.6 million in 2021.
Whilst the forecast for 2025 is that global sales will top 12.2 million vehicles, we believe a figure of 20.6m vehicles is more realistic which would mean that the silver automotive demand, depending on the mix Hybrids/EVs, would more likely be between 185-300 Moz versus a conservative 90 Moz of silver forecast for 2025 by IHS.
Source: The Silver Institute